- Enterprise UX · Cybersecurity
- IIT Kanpur
- 2024
CISO dashboard · C3iHub, IIT Kanpur
Turning scattered security alerts into one view a CISO can act on
A centralised cybersecurity platform for an international insurance firm. It replaces phone calls, WhatsApp messages and mail threads with one place to monitor incidents, track risk and make decisions faster.
- My role
- Lead designer. Owned the platform’s UX and brought the team’s work together into one product
- Team
- Service designer, design researcher and visual designer, under the C3iHub CTO
- Timeline
- January to December 2024, research to client handover
- Method
- Ecological Interface Design, mapped to ISO 27001, NIST CSF and IRDAI guidelines
01
The brief
The firm’s security leadership had no single place to see what was happening. Critical alerts arrived by phone and WhatsApp, reports were compiled by hand, and monitoring was split across separate consoles.
The team called the central tension the duality: operational depth for the people running security, and boardroom simplicity for the people answerable for it. Auditors added a third requirement. The same data had to work for all three.
SOC team and CITSO
Depth to act
Enough detail to work an incident from start to finish without switching between consoles.
CISO and the board
Speed to decide
The organisation’s security posture readable at a glance, with the next action obvious.
IRDAI auditors and NIST certifiers
Proof to audit
Every number traceable back to the framework or regulation it reports against.
02
Watching the work, not just asking about it
We interviewed the main stakeholders and shadowed the security operations centre. Five days covered routine operations. The other nine fell during a live critical incident, so we saw the existing process under real pressure, not as it was described to us.
- 12End users interviewed
- 14Days shadowing the SOC team
- 9Of those days during a live critical incident
- 3Personas for the key decision-makers
This was enterprise software with a known, fixed set of users. Interviewing the twelve people who would actually use the platform covered the audience, so wider recruitment wasn’t needed.
The personas focus on the three roles that shape decisions: the CISO, the CITSO who runs the security teams, and the AVP responsible for risk management.
Designed against a simulated environment
Live security systems are never opened up to a design team. The client provided a simulated environment built from months of processed operational data and sample spaces, which we used to study the workflow and design its integration into a single interface. All screens on this page use that sample data.
Persona names are fictional.
03
How an incident reached the CISO before
Information moved up a chain of people. For routine work, the operations team collected patch data in Excel, a team lead compiled it into a report, and the CISO received it as a PDF by email. For critical incidents, the team lead opened a mail thread with the CISO and posted each update into it until the thread was closed.
Nothing in that chain was visible as a whole. The CISO saw what arrived in the inbox, when it arrived.
What the affinity map showed
We clustered observations from the interviews, the shadowing and the firm’s governance documents. Four themes came out of it.
A web of channels
P1 alerts arrived by phone, WhatsApp and mail. Updates lived in separate war room chats, often as screenshots.
Fragmented monitoring
SolarWinds, MQ Console and the load balancer each had their own console. Patch compliance was tracked by hand.
Manual governance
Weekly reports were assembled by hand. Risk sat between the AVP and the CITSO with no shared view.
What users asked for
A single pane of glass, automated routine reports, and an easy way to track work across teams.
04
Why Ecological Interface Design
Most dashboards are designed around tasks. But a critical incident is the moment the expected tasks stop working. Ecological Interface Design models the work domain itself: what the system is for, what constrains it, and how the physical pieces serve those goals. An interface built on that model supports people when something unexpected happens, not just when everything follows the script.
It is used in process control, aviation and medicine for that reason. We built two models with it.
Decomposition hierarchy: what the system is made of
Cybersecurity governance splits into a human subsystem (the NOC, SOC, CISO and IT teams) and a technology subsystem (reports and software for monitoring, automation and communication).
Abstraction hierarchy: why each piece of data matters
The abstraction hierarchy links every raw data point to the purpose it ultimately serves. Read upward, each level answers why. Read downward, it answers how.
- Functional purposeWhy the system exists
- Abstract functionFrameworks and regulations it answers to
- Generalised functionProcesses such as incident response
- Physical functionTools and reports that do the work
- Physical formThe raw data: IPs, counts, timestamps
The weak point was the jump from regulation to implementation.
Telemetry captured technical metrics reliably, but mapping them back to compliance frameworks was manual, high-friction work. Adding more monitoring tools at the bottom of the hierarchy would only add noise. The fix was to make the middle layers, incident response and threat intelligence, visible as the bridge between raw data and business risk.
Trace a widget back to its purpose
Pick a part of the dashboard to see the path it follows through the hierarchy. This is how the model shaped the interface: purpose decided what earned a place on screen, and the form level decided what that element actually shows.
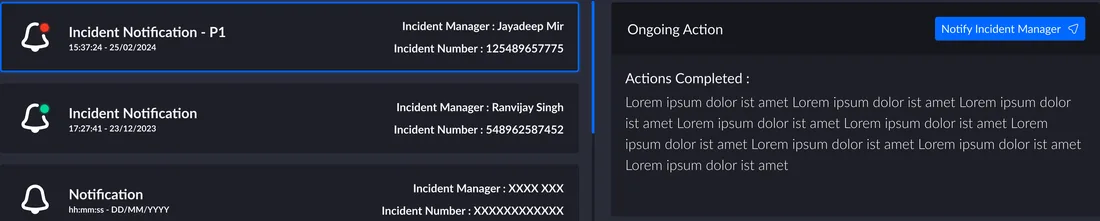
- Functional purposeWhyAllows the CISO to quickly assess the security status of the organisation
- Abstract functionAnswers toRisk management framework
- Generalised functionProcessIncident response process
- Physical functionTool or reportSoftware for quick notification
- Physical formData shownTimestampStatusRemarks
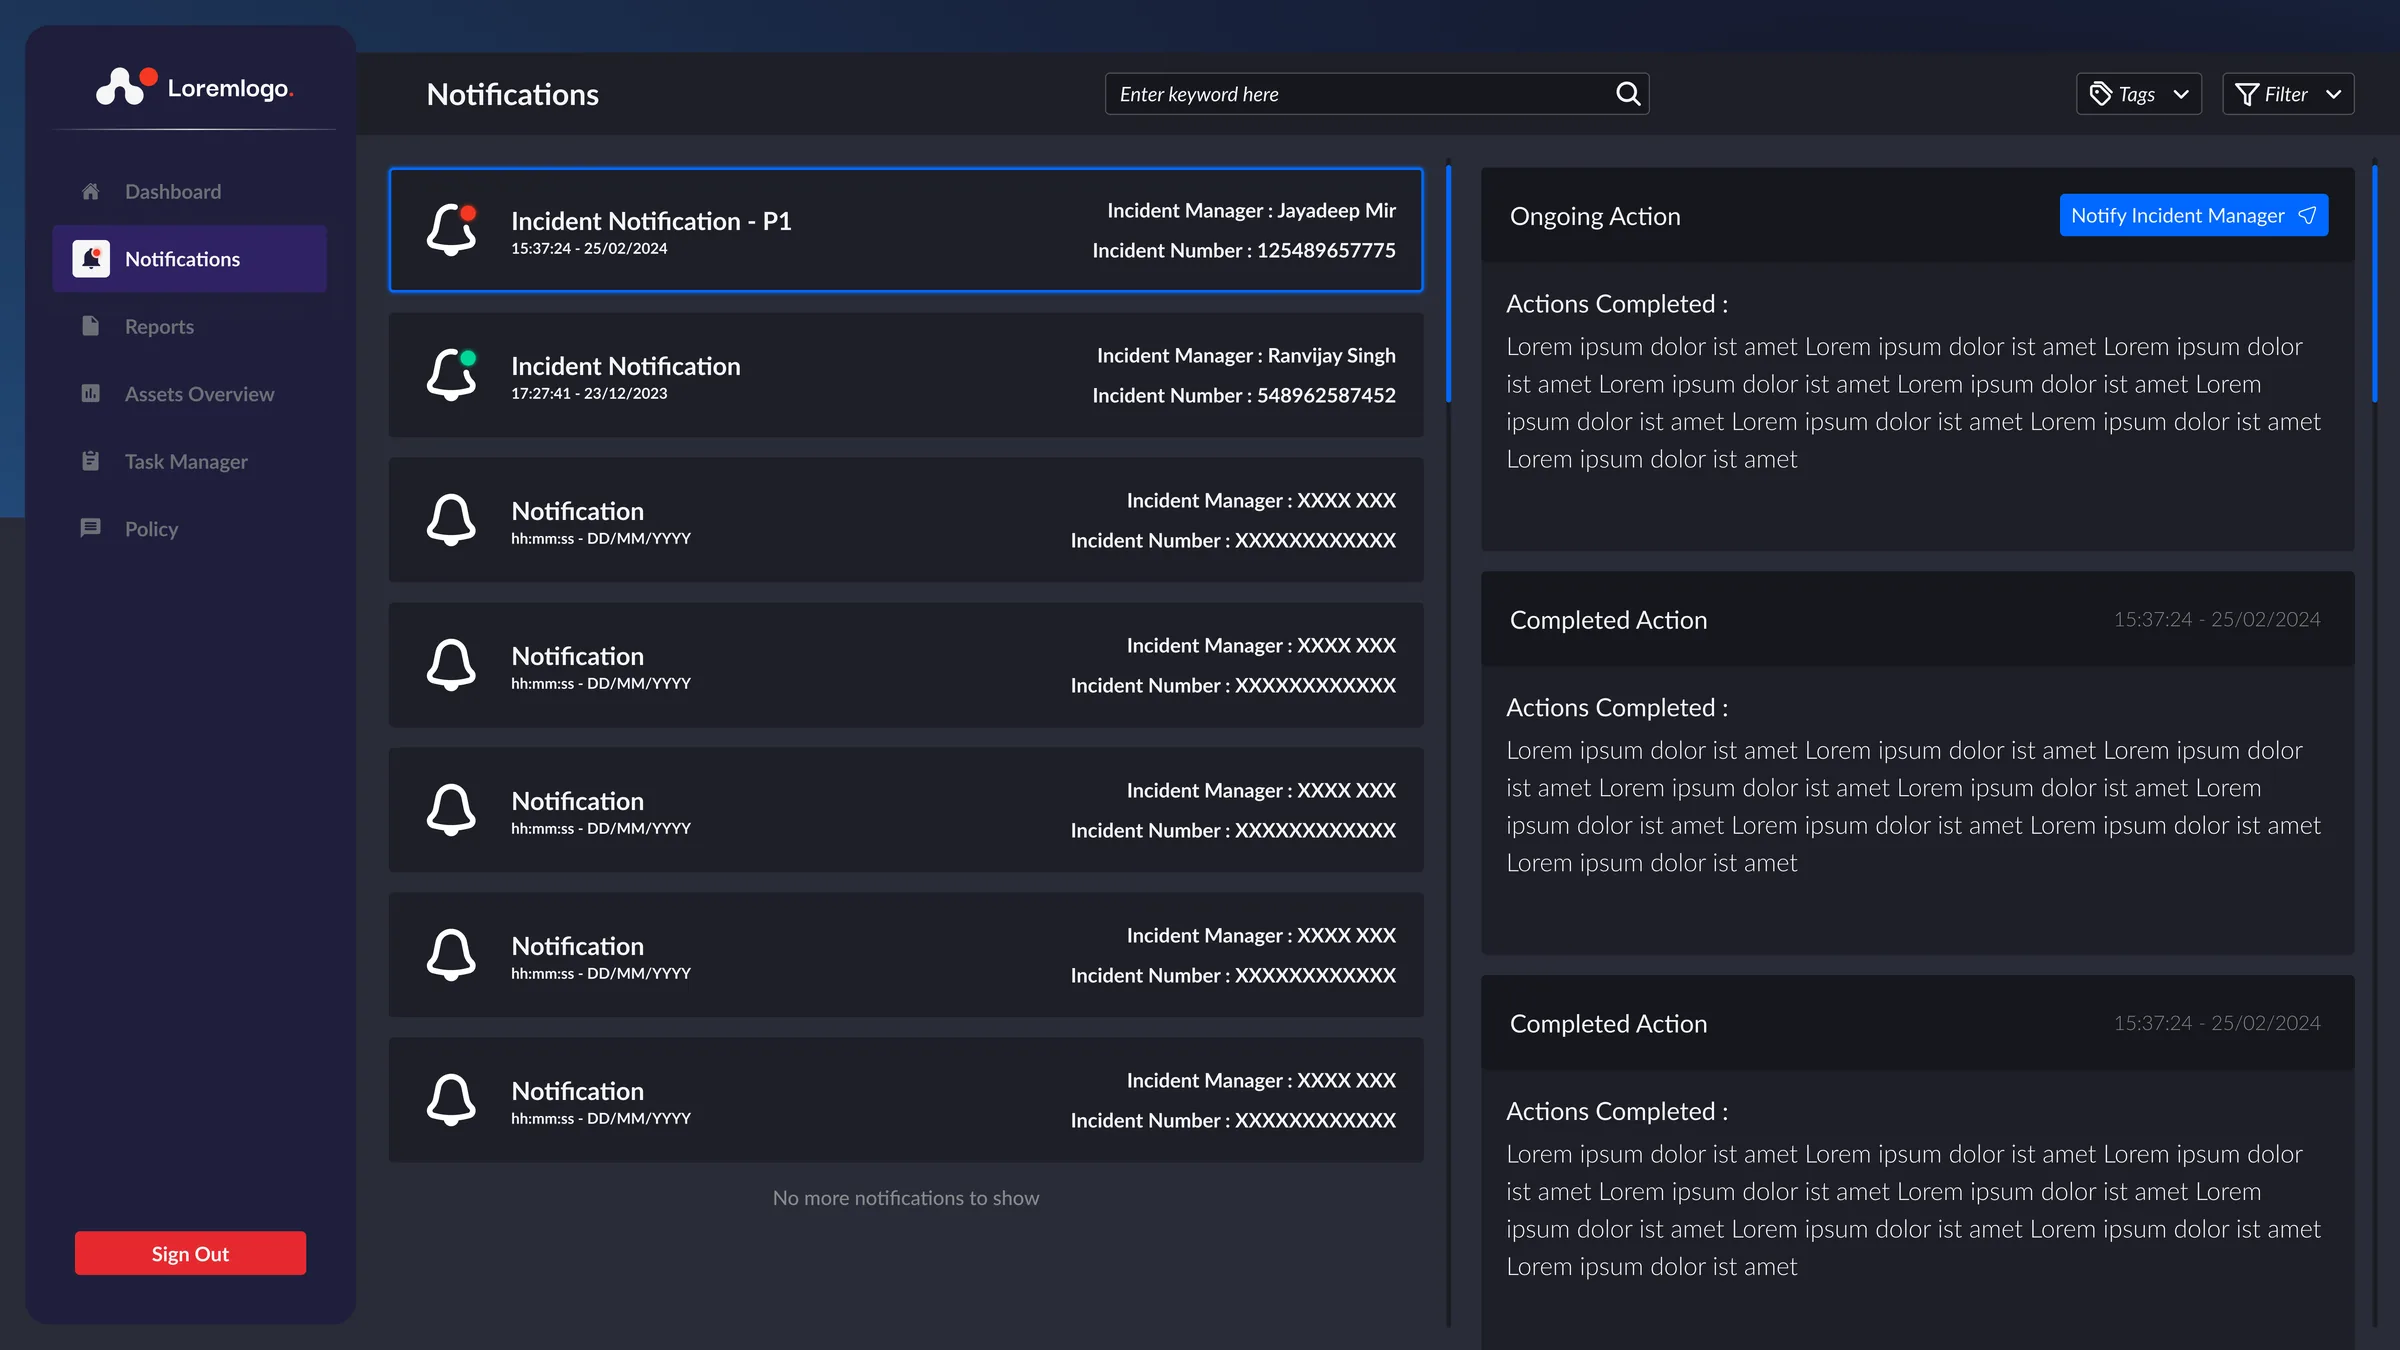
Because the purpose is a quick assessment by the CISO, a P1 incident gets its own marker, the incident manager’s name and the incident number right on the card. The completed actions sit in the panel beside it, not in a mail thread.
Simplified to one path per element. In the full hierarchy, links are many-to-many.
05
From findings to features
Each step in the old chain became something the platform does directly.
Before
P1 alerts by phone and WhatsApp
Easy to miss, impossible to look back on
In the platform
Notifications marks P1 incidents and shows the incident manager and incident number on the card.
Before
Updates buried in a mail thread
The current status meant reading the whole thread
In the platform
An action panel beside each notification lists ongoing and completed actions, with a button to notify the incident manager.
Before
Screenshots and Excel files in war room chats
Shared for reference, then lost in the scroll
In the platform
An upload form that asks for a category and tags, so every file lands in a searchable archive.
Before
Weekly reports compiled by hand
A late report was noticed only if someone noticed
In the platform
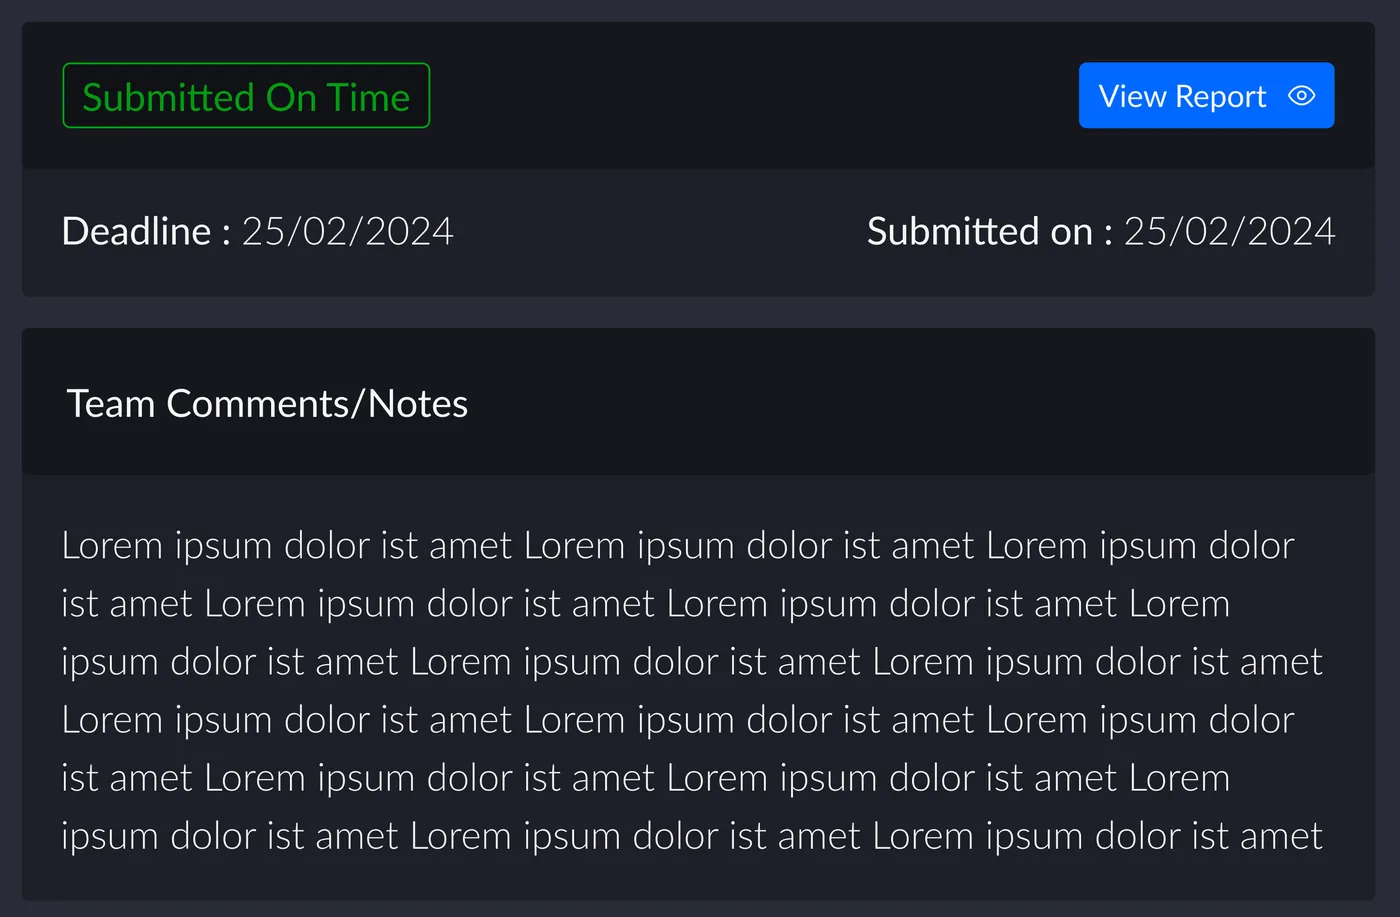
A reports archive that shows each report’s deadline next to its submission date, with a clear status. See below.
Before
A separate console for every tool
SolarWinds, MQ Console, load balancer, health checks
In the platform
Assets Overview brings them together as tabs, and Security Overview summarises them on the first screen.
Before
Patch work tracked by hand
No shared view of who was doing what
In the platform
A task manager board, plus task progress by severity on the CISO’s overview.
06
Five sections instead of a dozen tools
The information architecture collapses every console, chat and report into five sections: Dashboard, Notifications, Reports, Assets Overview and Task Manager.
Assets Overview carries the most weight. It absorbs the monitoring tools and health checks that each had their own console before: SolarWinds, MQ Console, the load balancer, and network, database, storage, backup and infrastructure monitoring.
07
The platform
A dark interface built for long sessions in a security operations setting, with the same sidebar on every screen and dense data kept readable through one consistent severity scale.
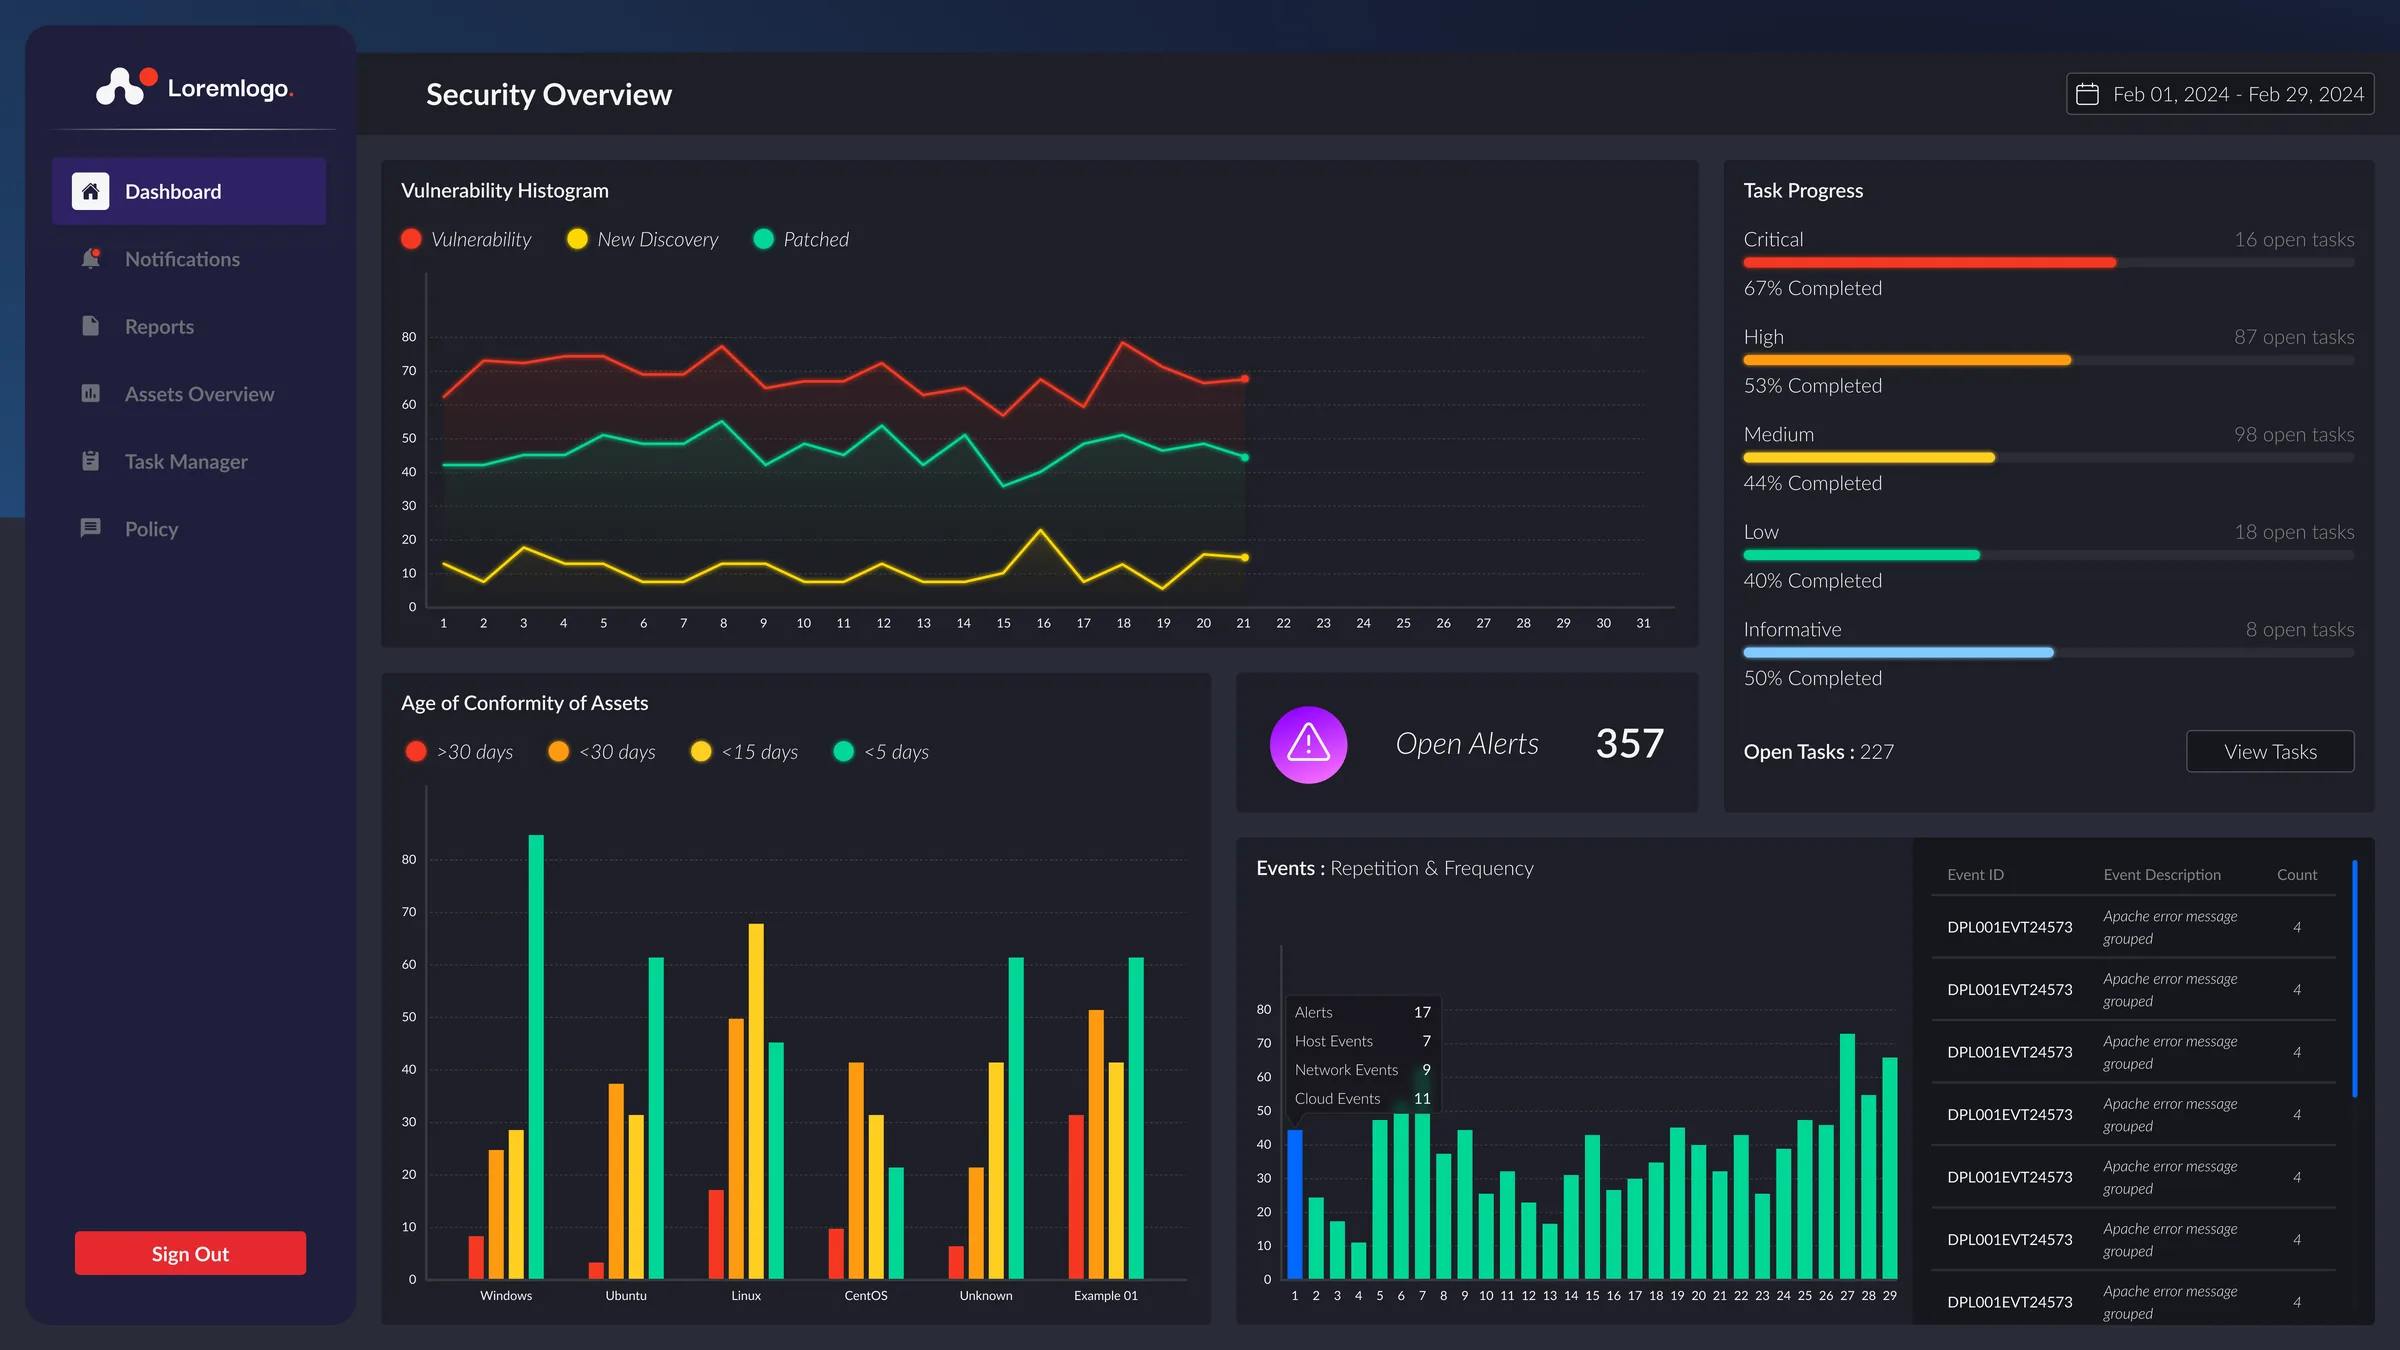
The CISO’s first screen. Vulnerability trend, asset conformity by operating system, open alerts, event frequency and task progress by severity, all for a chosen date range.
The monitoring consoles in one place, as tabs for assets, patches, vulnerabilities, compliance, firewall, policies and tasks. Headline counts sit above the charts.
A list and an action panel side by side. P1 incidents are marked and show the incident manager and number. The panel lists ongoing and completed actions, with a direct way to notify the incident manager.
Every report in one archive, tagged by type and team, with search, tags and filters. Each report can be downloaded straight from the list.
Uploading asks for a category and up to seven tags before the file goes in, so it can be found later. This replaced sharing screenshots and Excel files in chat.
A board with completed, in progress and to do columns. Each card carries its priority, progress and tags, with notify and assign actions on the card itself.
A plain sign-in with a direct helpdesk contact for anyone locked out. The contact address is blurred here.
08
Making late reports visible
Weekly reports used to arrive as PDFs by email. If one was late, nothing flagged it.
In the archive, every report shows its deadline beside its submission date. The status and the available actions change with it, so the next step is always on screen.
09
Testing and iteration
We tested the dashboard with real end users in the simulated environment, comparing the final design with our own first iteration. The old process varied too much from incident to incident to serve as a reliable baseline, so we measured against something we could hold constant.
- Time-to-insight testing
- Cognitive walkthrough
- Colour and severity accessibility check
- Boardroom translation testing
- Secondary audience testing
12–15%
Reduction in incident resolution and call-to-action time, compared with the first iteration.
~8 sec
Faster response time. In a critical incident, seconds decide how quickly the right person starts acting.
Measured with real users in simulated conditions. Figures are approximate.
10
Visual language
A deep slate palette keeps the interface calm over long shifts, so colour is free to mean something. Severity uses the same five colours on every chart, card and progress bar, and blue is reserved for actions.
The platform’s palette, not this site’s
Severity scale
Critical #F53821, High #FF9B10, Medium #FFCE20, Low #00D796, Informative #80CAFF
Page
#2A2C38
Cards
#1E1F27
Sidebar
#1F1F3B
Actions
#0168FF
Selected nav
#2F2263
Sign out
#E6292F
One scale, every chart
The same order and colours appear in the vulnerability chart, the event bars and task progress, so a reader learns the scale once.
- Dual pane
- List on the left, detail and actions on the right.
- Layered surfaces
- Cards sit one step lighter than the page.
- Focused modals
- The page blurs behind tasks like uploading.
- Self-contained cards
- Each task carries its own status and actions.
11
Outcome
The design was handed over in November and December 2024 for deployment on the client side. C3iHub’s CTO and chief advisor led development and deployment, with me as the contact for all design and research work.
Model the domain, not the screen
Building the abstraction hierarchy first meant every element on the dashboard had a reason to be there, and that reason could be traced all the way to a regulation.
Watch the work under pressure
Shadowing a live critical incident showed where the old process broke down in ways interviews alone would not have revealed.
One dataset, several readers
Designing for operational depth, boardroom simplicity and audit traceability at once forced a clear hierarchy on every screen.